Installation of LNav app on Linux Mint.
LNav — Navigate and Analyze Log Files Like a Pro
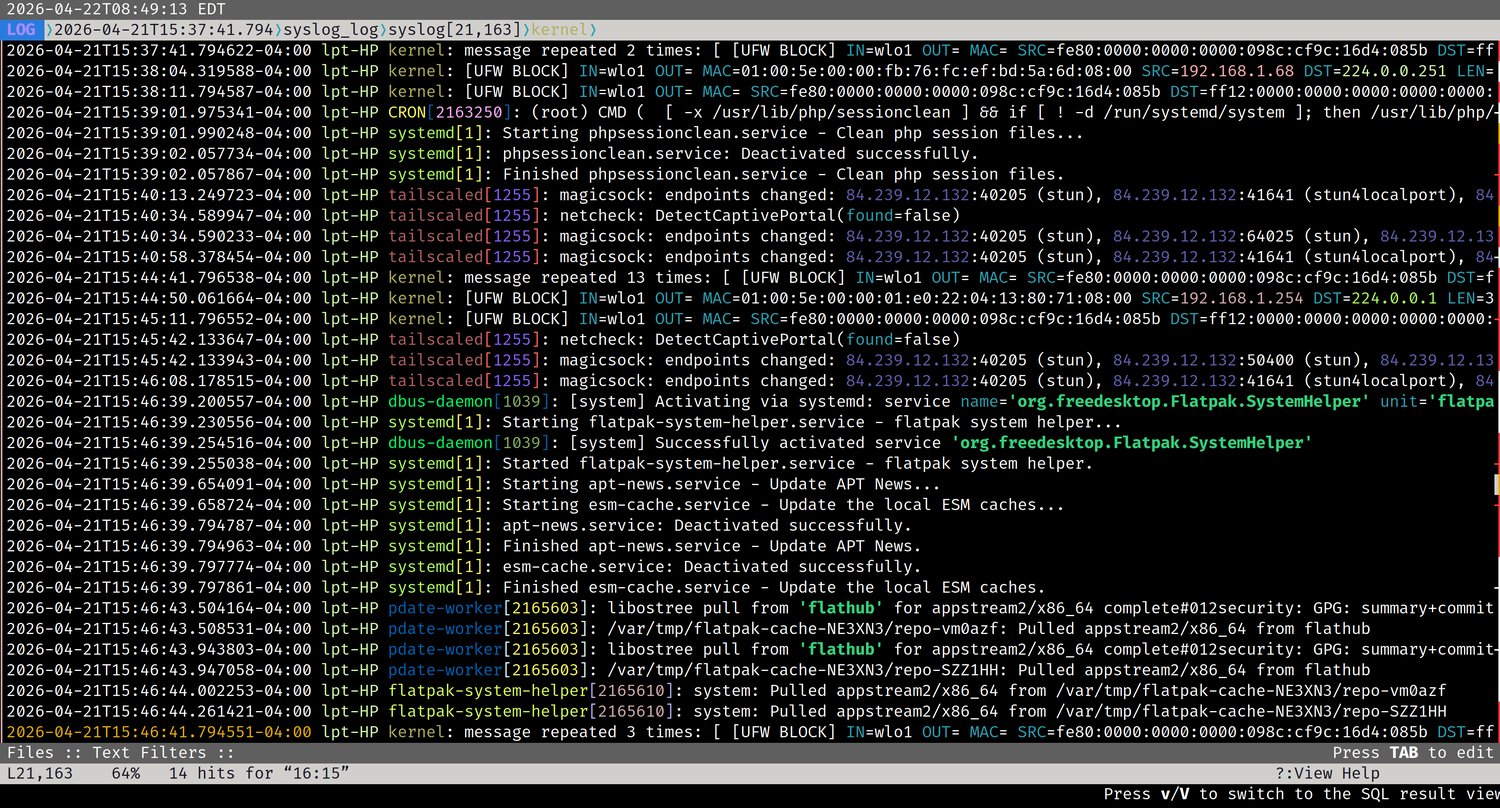
LNav (Log File Navigator) is a terminal-based log viewer that makes navigating and analyzing Linux log files significantly easier than using standard tools like cat or tail. It colorizes output, lets you jump between errors and warnings instantly, merge multiple log files into a unified timeline, filter noise in and out, and even query logs using SQL. It is lightweight, fast, and works well even on large log files.
Installation
LNav is not installed by default on most distributions. On Linux Mint and other Debian-based systems:
Opening a Log File
Most system log files require sudo since they are owned by root. If you get a permission denied error, add sudo in front.
You can open multiple log files at once and LNav will merge them into a single chronological timeline:
When viewing merged logs, the status bar at the top shows which file each entry belongs to as you navigate.
Basic Navigation
LNav uses vi-style keybindings for movement:
| Key | Action |
|---|---|
j / k |
Scroll down / up one line |
g / G |
Jump to top / bottom |
e / E |
Jump to next / previous error |
w / W |
Jump to next / previous warning |
Space |
Page down |
q |
Quit |
Jumping directly to errors and warnings with e and w is one of LNav's most useful features — no more scrolling through thousands of lines looking for problems.
Searching
Press / to open a search prompt at the bottom of the screen, then type your search term and press Enter:
Press n to jump to the next match and N to go to the previous match. Search is case-sensitive by default.
Filtering
Filtering is where LNav really earns its place in your toolkit. Press : to enter command mode.
Show only lines containing a term:
Hide lines containing a term:
You can stack multiple filters — for example, filter out UFW BLOCK and then filter out wpa_supplicant to strip away the two biggest sources of noise in a typical laptop syslog, leaving only the system activity that actually matters.
Reset all active filters and return to the full log view:
Tailing a Live Log
To watch a log file in real time as new entries are written, use the -t flag:
This is the LNav equivalent of tail -f.
Switching Views
LNav includes several views beyond the default log view. Switch between them using the command:
Replace histogram with any of the following:
| View | What it shows |
|---|---|
log |
Default — chronological log entries |
histogram |
Visual summary of log activity over time, broken down by errors, warnings, and normal entries |
timeline |
Message count per service — useful for identifying which service is generating the most noise |
pretty |
Formats structured log data such as JSON into a more readable layout |
The histogram view is particularly useful for spotting spikes in activity at a glance — a sudden jump in errors or warnings at a specific time tells you exactly where to focus your investigation.
SQL Queries
LNav exposes log data as a queryable database. Press ; to enter SQL mode:
This is useful for more precise analysis than text filtering alone, especially when working with structured or high-volume logs.
Recommended Log Files to Explore
These are the most useful logs to become familiar with on a Linux Mint or Debian-based system:
| Log File | What it contains |
|---|---|
/var/log/dpkg.log |
Package install, remove, and upgrade history — low noise, good for learning |
/var/log/auth.log |
Login attempts, sudo usage, PAM authentication events |
/var/log/syslog |
General system activity — kernel, networking, services |
/var/log/kern.log |
Kernel-only messages — hardware events, driver activity |
/var/log/apt/history.log |
High-level apt session history |
A good learning progression is to start with dpkg.log since it is low volume and well-structured, then move to auth.log for security-relevant activity, and finally syslog once you are comfortable filtering since it requires it.
Practical Example — Stripping Syslog Noise
On a typical Linux laptop, syslog is dominated by firewall and Wi-Fi management entries that are normal and expected but make it hard to see anything else. Filter them out in sequence:
What remains is the actual system activity worth reading — services starting and stopping, Tailscale endpoint changes, systemd unit activity, and anything genuinely unusual.